
For other industries or use cases, contact us to discuss your requirements


Understand portfolio risk across time
Build a clear picture of your portfolio by enriching asset locations, assessing natural hazard exposure, and bringing historical, real-time, and available forecast data into insurance risk workflows.
Blazing fast, cost-efficient, and easy to integrate, Rapid empowers our renewal processes and risk modeling. Fully automated geoprocessing and geoenrichment of smaller books or larger portfolios are no longer an issue.


Identify incomplete or inconsistent property records and enrich asset locations with relevant spatial information to create a more reliable foundation for portfolio risk assessment.
Automated geospatial processing helps prepare property data for analysis across individual records and larger portfolios, reducing the need for manual data preparation.
.avif)
.avif)
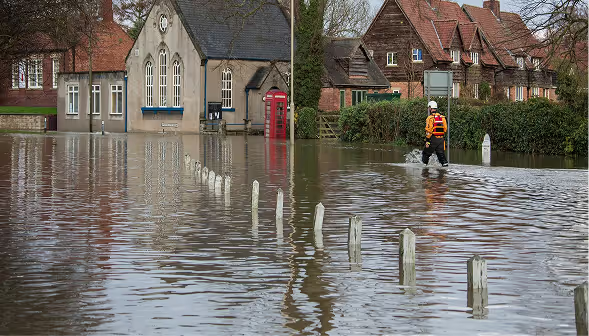
Understand how natural hazards intersect your insured assets and how exposure is distributed across properties, regions, and lines of business.
Combine insured locations with relevant hazard maps and risk data to investigate geographic concentrations, compare exposure across your portfolio, and identify areas that warrant closer assessment.
Bring historical hazard information, current conditions, and available forecasts into your risk assessment workflows to build a more informed view of changing exposure.
Compare hazard information across relevant time periods to investigate past events, assess current conditions, and support forward-looking analysis. This helps insurance teams incorporate changing hazard conditions into underwriting and portfolio management decisions.
.avif)

Make enriched location data and hazard information available to the teams and systems that depend on them.
Integrate structured geospatial data and analytical outputs into risk modelling, underwriting, pricing, portfolio analysis, and reporting workflows. Reduce manual data preparation and help teams work with more consistent, analysis-ready information.
Reliable portfolio data through validated and spatially enriched asset locations
Greater visibility into accumulated exposure across properties, regions, and natural hazards
Forward-looking risk analysis using historical, real-time, and available forecast data
Efficient portfolio processing through automated geospatial enrichment
Better-connected insurance workflows with reusable, analysis-ready spatial information
Quarticle brings geospatial processing, hazard intelligence, and spatial analytics together to help insurers transform portfolio location data into actionable risk insights.

Enrich property locations with relevant spatial attributes and risk information. Automate geoprocessing across smaller books and larger portfolios to prepare more complete, analysis-ready data.

Integrate natural event information into insurance workflows to help identify potentially exposed assets and support timely assessment of relevant events.

Visualise insured locations on interactive maps to examine geographic distribution, explore spatial patterns, and investigate concentrations of exposure across a portfolio.

Connect geospatial data and analytical outputs to existing insurance applications and data platforms through supported APIs and interfaces.
Use enriched property data and hazard insights to inform risk selection, pricing, and modelling.
Identify geographic concentrations of insured assets and assess how exposure is distributed across a portfolio.
Incorporate hazard information and available forecasts into exposure assessment, catastrophe risk analysis, and planning.
Improve asset location data quality and automate the preparation of spatially enriched portfolio data for downstream analysis.
Prepare spatially enriched portfolio data to support accumulation analysis, portfolio assessment, and reinsurance submissions.