Location Intelligence for Retail and Logistics

Other providers give you raw data. We give you decisions.

With Quarticle, you don’t just get numbers, you get actionable insights directly in your workflow.

Why Smart Location Planning Is Critical

Every expansion or network optimization is costly. Success depends on knowing who you can reach, how quickly you can serve them, and where gaps or bottlenecks exist.

Quarticle provides the intelligence layer you need to:

Identify profitable sites for growth
Spot and fix delivery bottlenecks before they cause delays
Balance cost, service, and sustainability
Plan confidently for peak seasons and long-term expansion

Intelligence Where It Matters Most

Retail Expansion and Site Selection

Designed for business analysts, not just data scientists. Get fast insights without the unwanted complexity.

Customizable catchment modeling
Move beyond generic demographics with real pedestrian and drive-time catchments, factoring in traffic, accessibility, and real-world obstacles.
White-spot analysis
Identify underserved areas with high potential from missing store coverage to gaps in pick-up/drop-off points.
Demand & competitor analysis
Combine income levels, foot traffic, and competitor presence to forecast store performance.
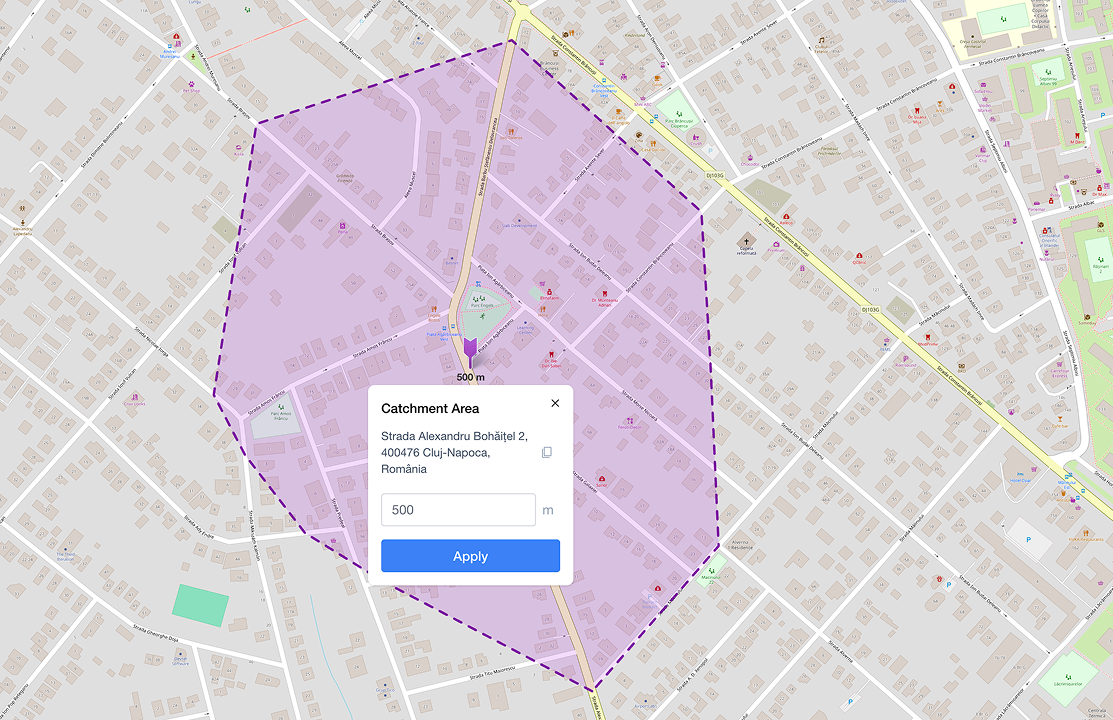
A map interface displaying a "Catchment Area" tool in Graph by Quarticle. The map shows a purple polygonal overlay representing a 500-meter radius around a selected location on a city street grid in Cluj-Napoca, Romania.
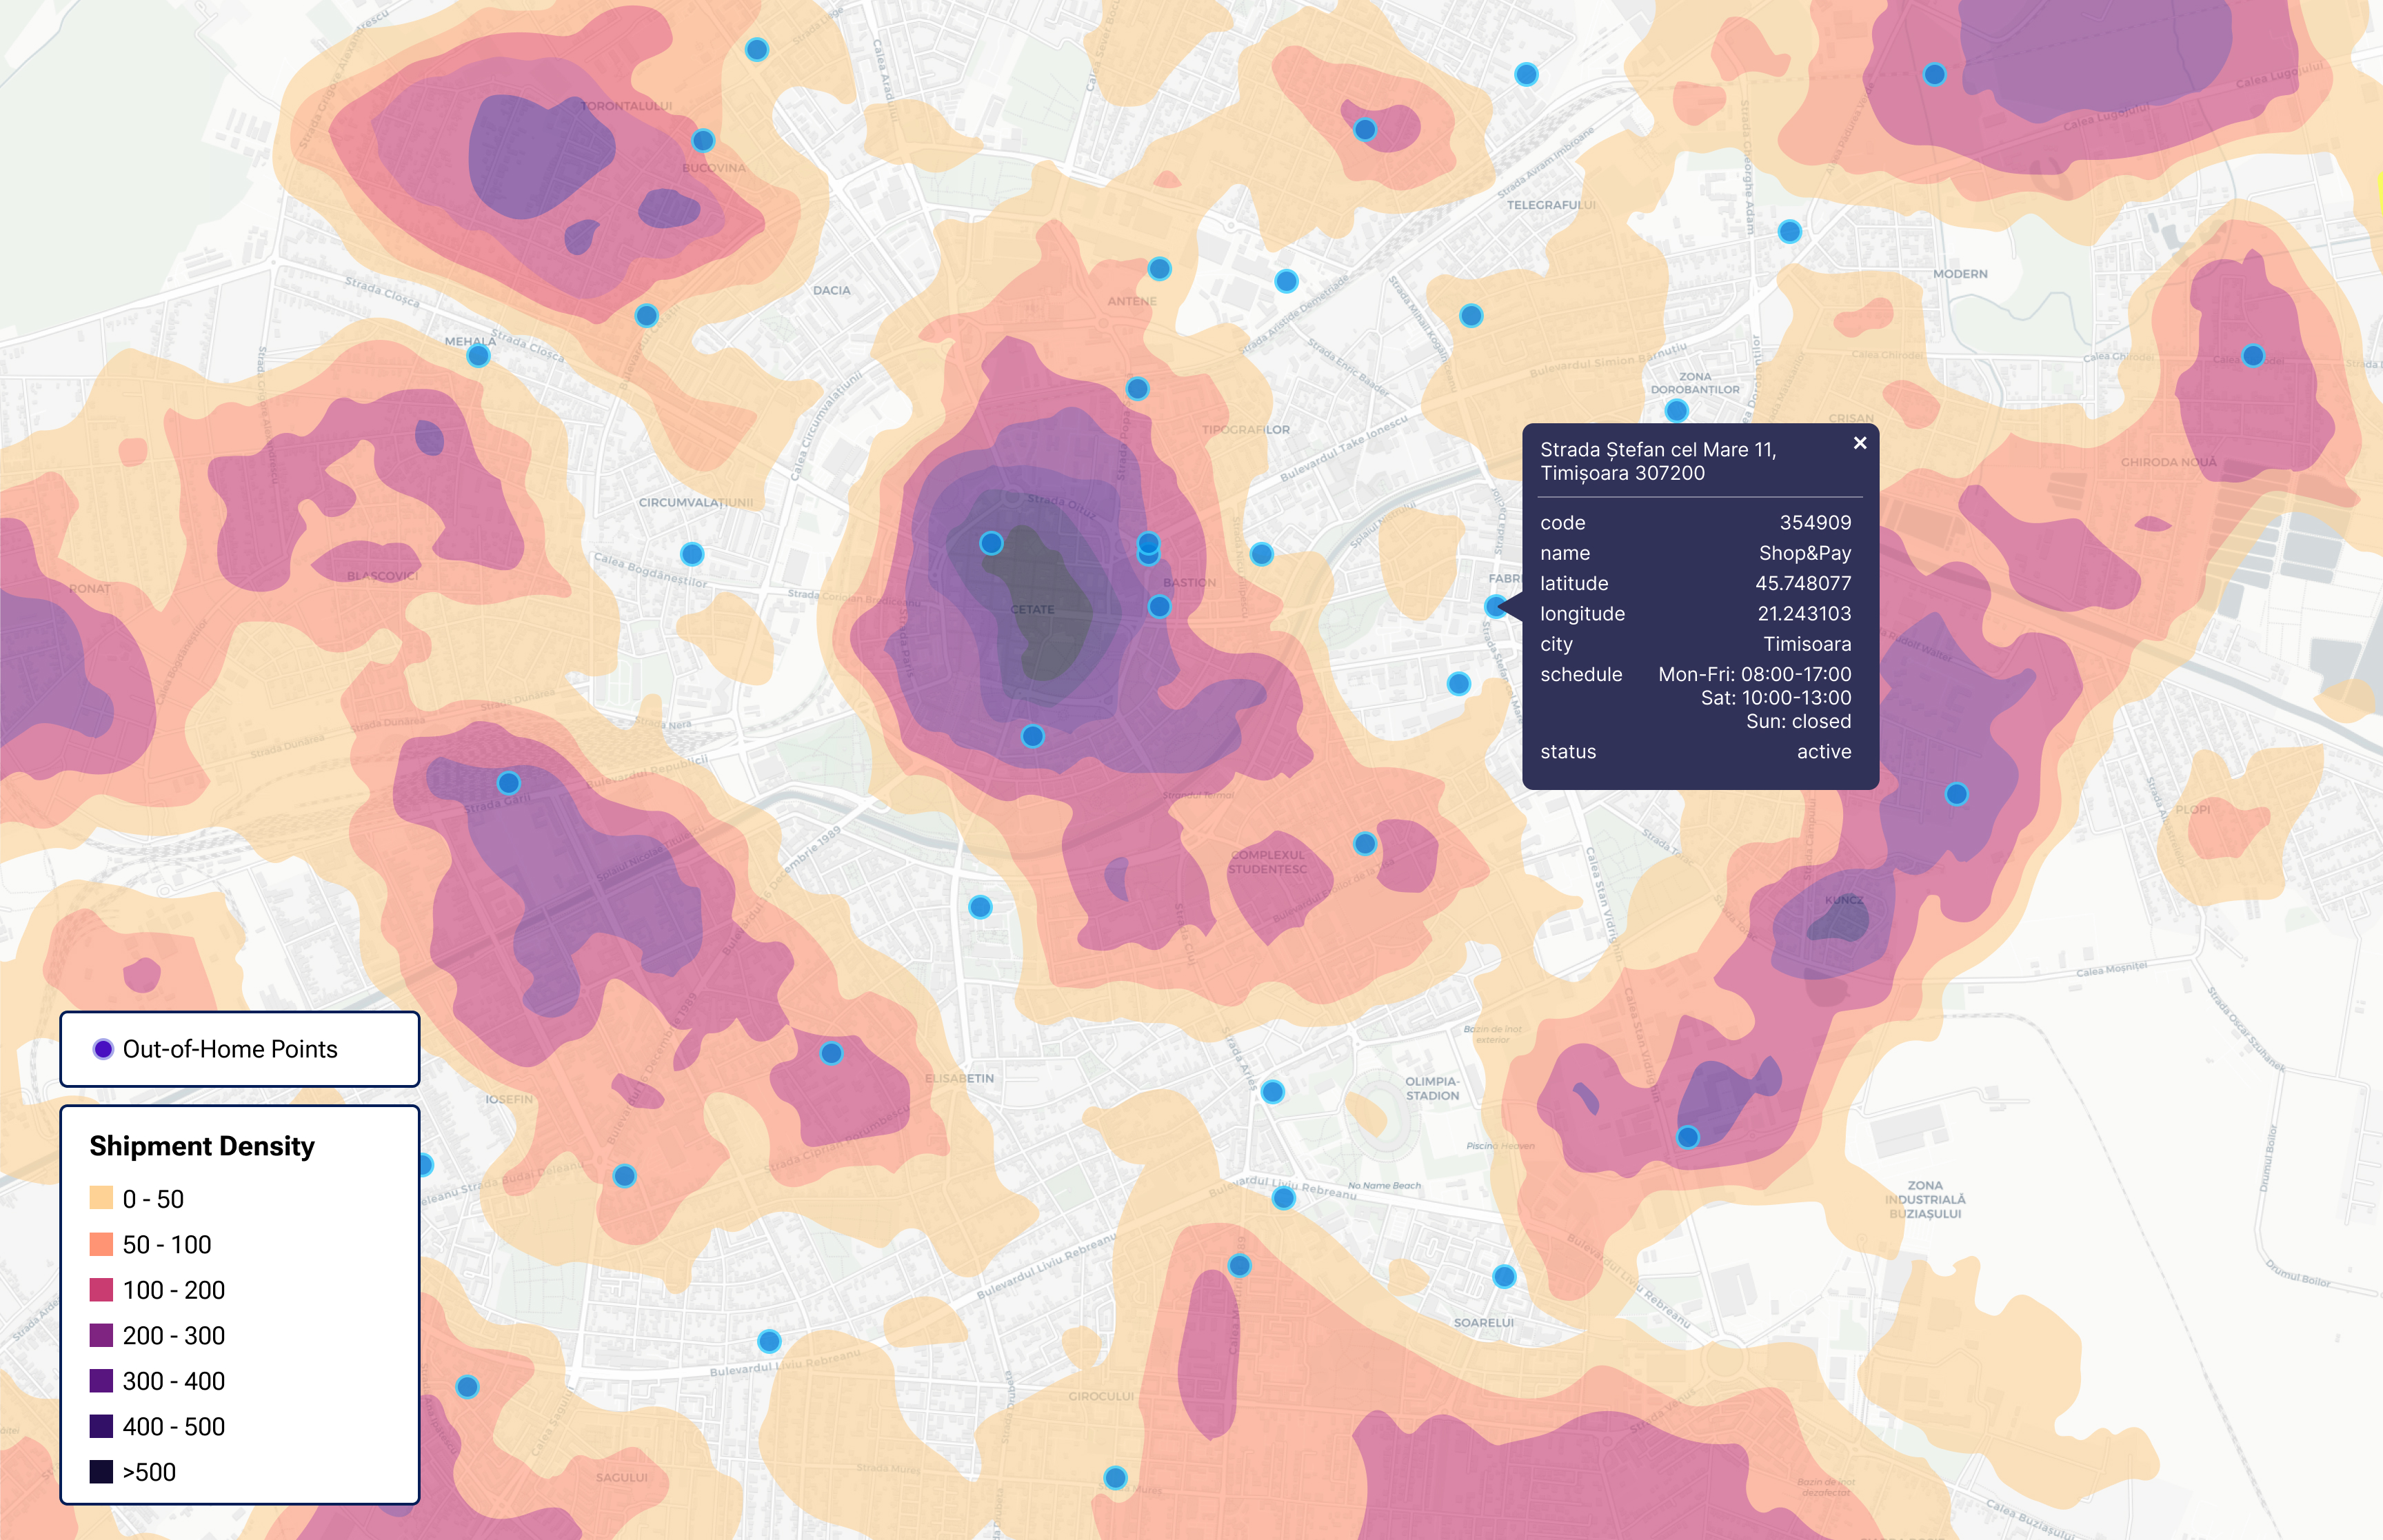
A multi-layered map in Graph by Quarticle showing colored heatmaps for shipment density and population density across a geographic region.
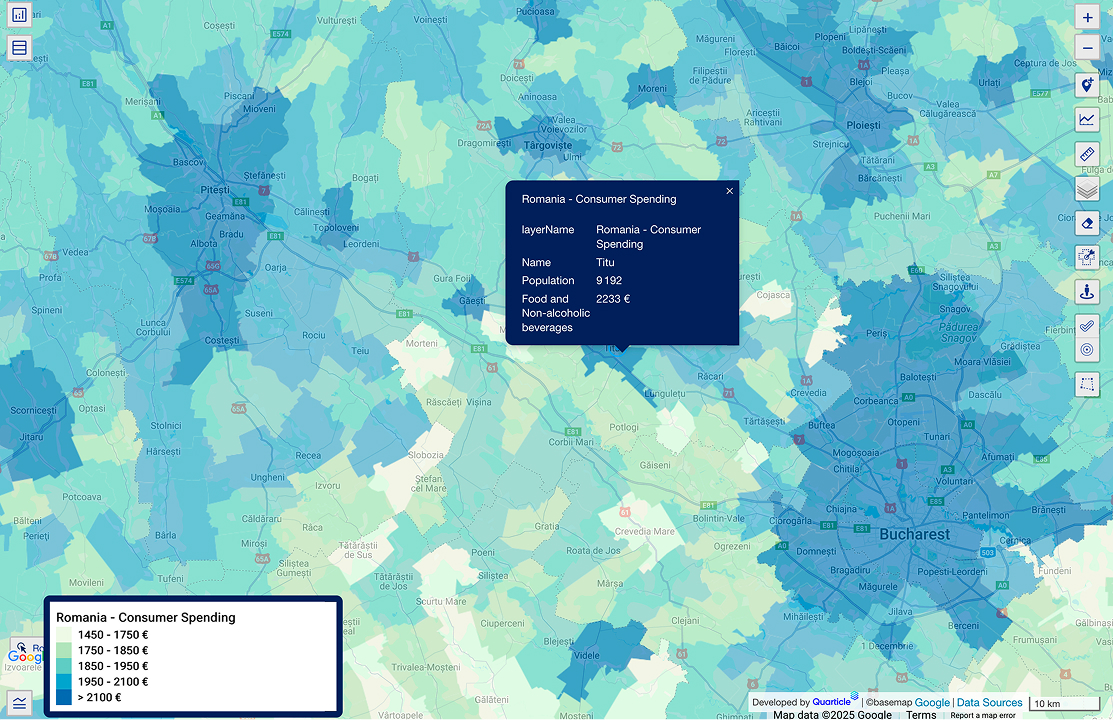
A regional heatmap showing the "Romania - Consumer Spending" layer and data across various districts. The map uses a color scale from light yellow to dark blue to represent spending levels, with a pop-up window providing specific population and spending data for a specific area.
A map of Timișoara, Romania, showing a "Population Density" heatmap with color-coded levels ranging from "Very Low" to "Very High". Overlaid on the density data are point markers indicating the locations of "Active Lockers" in blue and "Inactive Lockers" in white. This analysis is useful for a logistics company.
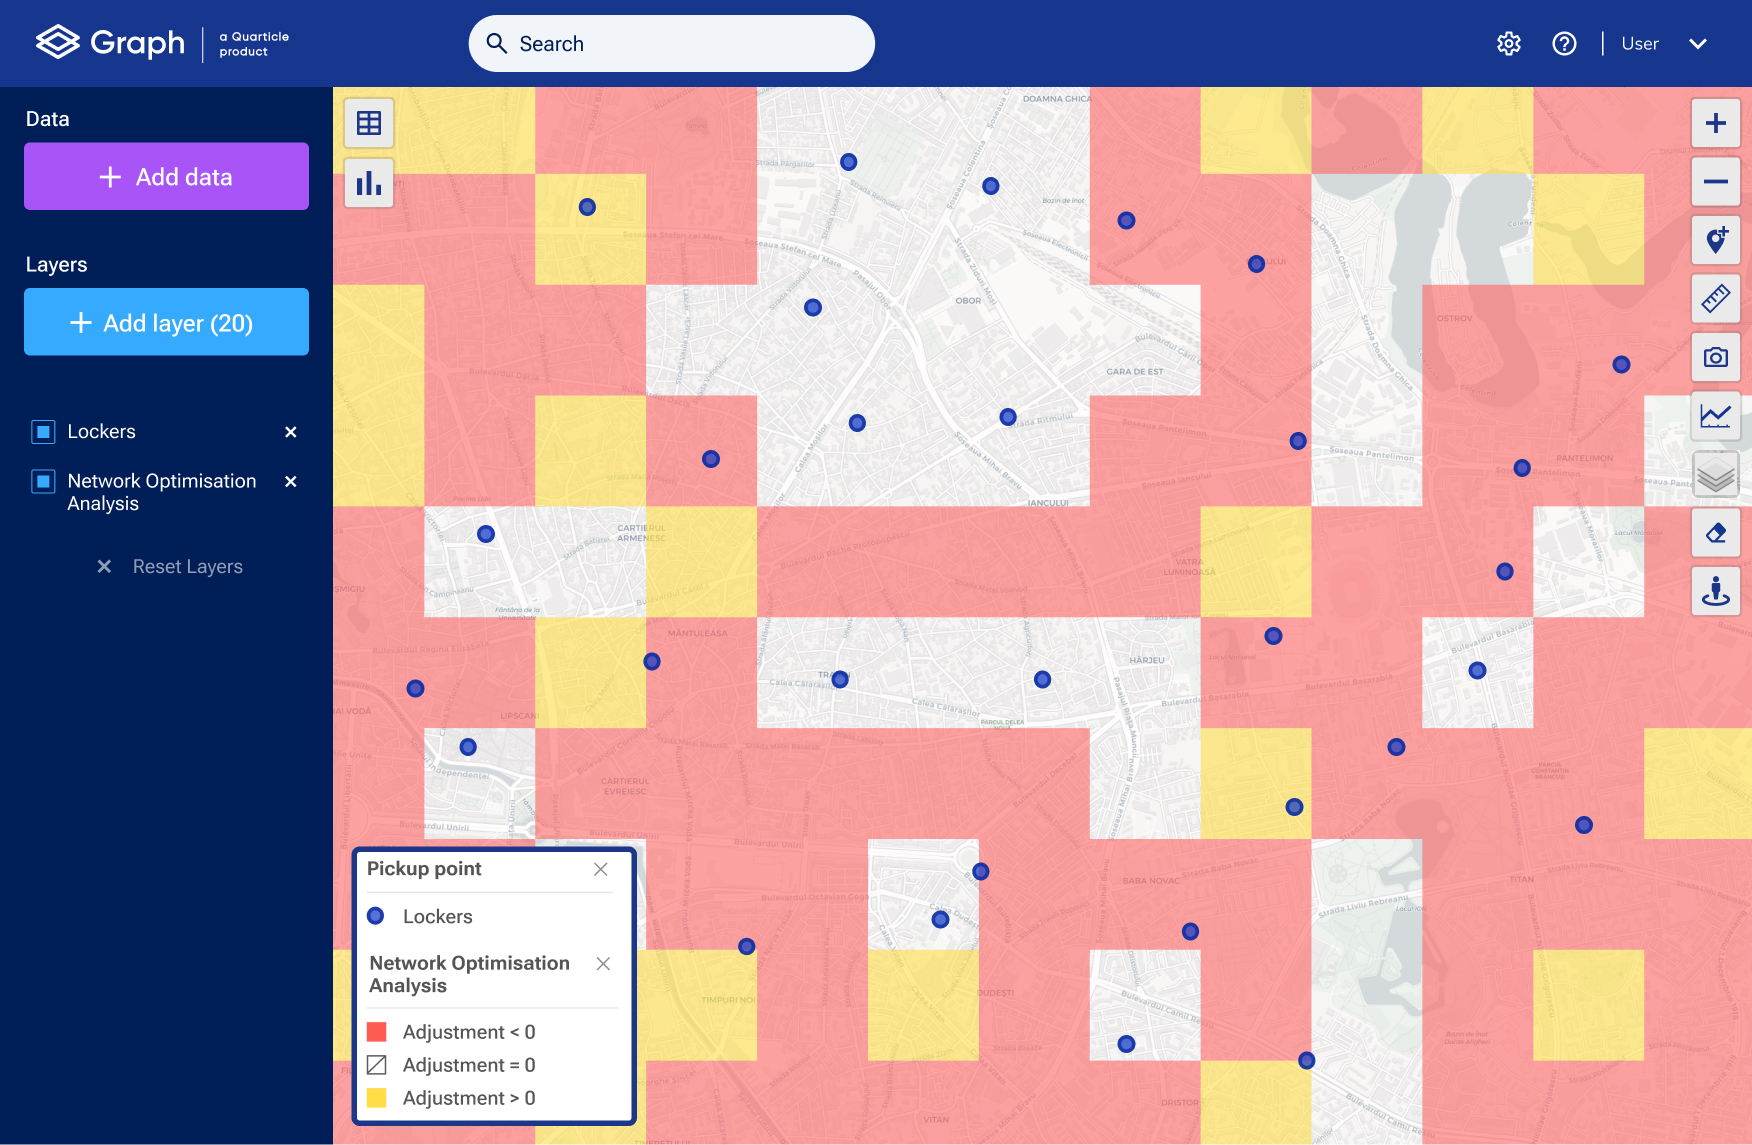
A screenshot of the Graph by Quarticle interface displaying a "Network Optimization Analysis" on a city map. The map is covered with a grid of red and yellow squares indicating areas where adjustment is needed, overlaid with blue circular markers representing locker pickup points.
A detailed GIS map showing the “Population per zipcode” geographic layer in Romania using a color scale from light yellow to dark purple to represent population density. The map also features a secondary legend for "Transport and storage" industry data, showing financial values across different geographic zones.
Bring your own data
Layer your proprietary sales or customer data alongside our intelligence for sharper forecasts.
Scenario forecasting
Test alternative scenarios for new sites, network expansions, or location strategies.
Customer profile alignment
Match potential sites with local demographic and purchasing behavior data to ensure each new location fits your target customer base.

Logistics and Route Optimization

Purpose-built for route planners and operations teams. Turn complexity into clarity.

Geocoding for precision:

Convert raw addresses into exact geographic coordinates to improve mapping and routing accuracy and reduce delivery errors and delays.

Comprehensive reporting & analytics:

Access clear, customizable reports that summarize performance, track KPIs, and reveal opportunities in route efficiency and network coverage.

Network & bottleneck analysis:

Visualize where deliveries slow down, identify staff shortages, and anticipate stress zones during peak seasons.

White-spot heatmaps:

Detect underserved zones where new delivery or collection points can add value.

Smarter routing:

Algorithms balance cost, time, and service quality across thousands of routes.

Seamless integration:

Cloud-native APIs connect directly with TMS (Transportation Management Systems) or GIS systems.

Facility & coverage planning:

Optimize depots, carrier territories, and pick-up/drop-off networks.

Sustainability & efficiency:

Reduce mileage, fuel use, and emissions while cutting operational costs.

Trusted by Cargus, the second-largest delivery service provider in Romania

solutionAchieved full visibility of the existing out-of-home (OOH) network
solutionIdentified over- and underserved areas using parcel and population density data
solutionEnhanced decision-making for network expansion and optimization
solutionImproved operational efficiency by reducing delivery times and costs
Discover how Cargus gained full visibility and optimized their OOH network with Quarticle

How Quarticle Stands Out

Actionable intelligence for every location decision

Explainable scoring and forecasts

Insights you can see, trust, and act on.

White-spot analysis and stress testing

Spot network gaps and simulate peak-season scenarios.

Custom data layering

Combine your own proprietary data with external demographics, mobility, and competitor feeds.

Simple to use but powerful tools

Dashboards built for retail planners and logistics teams, not just data experts.

Proven in retail and logistics

Trusted by national delivery networks and fast-growing retailers alike.

Use Cases at a Glance

Challenge
Quarticle Delivers
problemWhere to open the next store?
solutionCustomizable catchment modeling + revenue forecasting
problemHow to validate demand?
solutionDemographics + mobility + competitor layers
problemHow to optimize 1,000+ routes?
solutionScalable, GIS-driven routing intelligence
problemHow to reduce delivery costs?
solutionNetwork bottleneck analysis + smart allocation
problemHow to expand pick-up/drop-off points?
solutionWhite-spot heatmaps + coverage analysis

Business Impact

Speed up site selection from weeks to days.
Prevent bottlenecks and handle peak seasons smoothly.
Cut route mileage and fuel costs while delivering faster.
Lower emissions and waste with optimized routing.
Improve forecast accuracy with real-world traffic data.
Empower teams to make fast, confident decisions.
Identify underserved areas to expand your network strategically.

Turn location data into better decisions today.